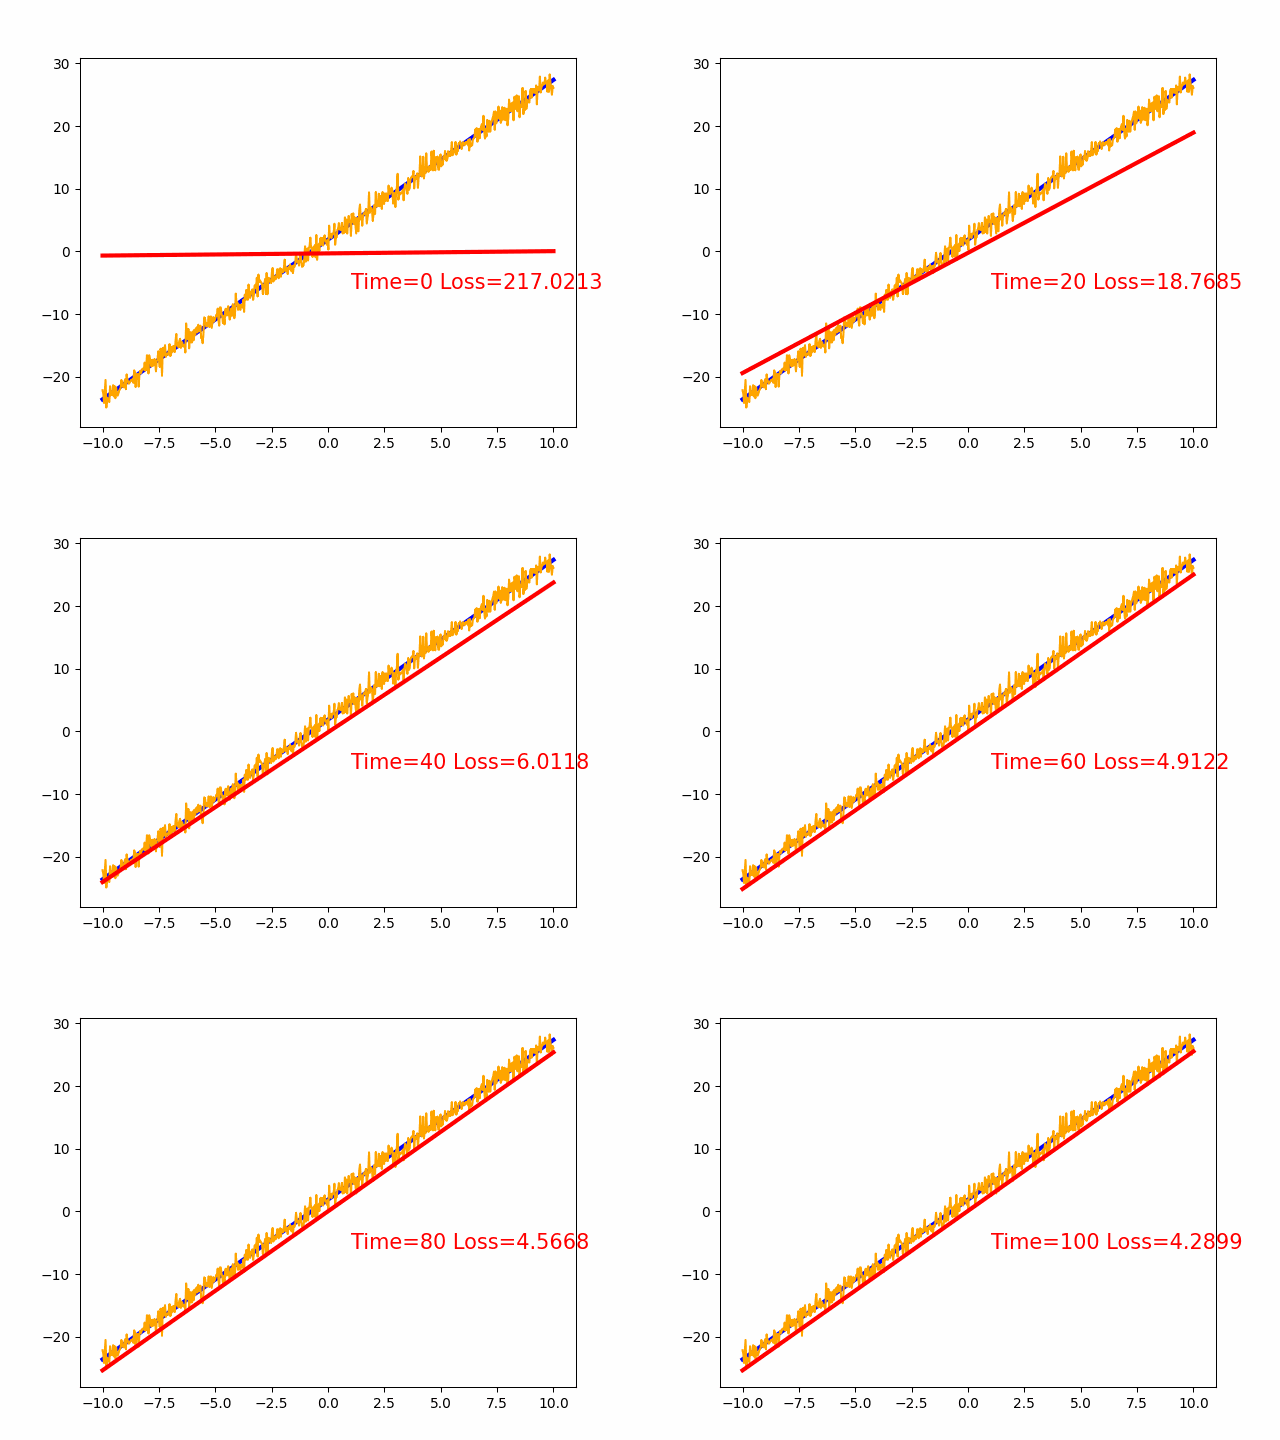
神经网络拟合线性模型可视化

0.实验效果

1.实验目的

实现用神经网络拟合线性模型的可视化

  • 运行python文件的时候可视化

  • 运行python文件后保存为gif图

2.运行python文件的时候直接可视化

1
2
3
4
5
6
7
8
9
10
11
12
13
14
15
16
17
18
19
20
21
22
23
24
25
26
27
28
29
30
31
32
33
34
35
36
37
38
39
40
41
42
43
44
45
46
47
48
49
50
51
52
53
54
55
56
57
58
59
import torch
from torch import optim
from torch import nn

from matplotlib import pyplot as plt

# device = torch.device("cuda" if torch.cuda.is_available() else "cpu")

# 准备数据
inputs = torch.unsqueeze(torch.linspace(-10,10, 600),dim=1)

targets = 2.55*inputs + 1.89 + torch.normal(0, 1, inputs.shape)

real = 2.55*inputs + 1.89

# 搭建网络
class NetWork(nn.Module):
def __init__(self):
super(NetWork,self).__init__()
self.linear = torch.nn.Linear(1,1)

def forward(self,x):
x = self.linear(x)
return x


# 定义网络
network = NetWork()

# 定义损失函数
loss_fn = nn.MSELoss()

# 定义优化器
optimizer = optim.SGD(network.parameters(),lr=0.001)

fig = plt.figure()

for i in range(100):
out = network(inputs)
loss = loss_fn(out,targets)
optimizer.zero_grad()
loss.backward()
optimizer.step()
# 可视化训练结果
if i%2 == 0:
# 清除当前的Axes对象
plt.cla()
# 绘制真实的曲线
plt.plot(inputs.numpy(),real.numpy(),c='blue',lw='3')
# 绘制有误差的散点图
plt.plot(inputs.numpy(),targets.numpy(),c='orange')
# 绘制神经网络实时预测的曲线
plt.plot(inputs.numpy(),out.data.numpy(),c='red',lw='3')
plt.text(1, -6, 'Time=%d Loss=%.4f' % (i, loss.data.numpy()), fontdict={'size': 15, 'color': 'red'})
# 必须暂停以显示
plt.pause(0.1)
for name, param in network.named_parameters():
if param.requires_grad:
print(name,param)

3.运行python文件后保存为gif图片

运行下面代码后将在同一目录下生成dynamic_images.gif图片。 (如本文开头所示)

  • 多个plot怎么放到一帧中

  • 更新每一帧中的文字

1
2
3
4
5
6
7
8
9
10
11
12
13
14
15
16
17
18
19
20
21
22
23
24
25
26
27
28
29
30
31
32
33
34
35
36
37
38
39
40
41
42
43
44
45
46
47
48
49
50
51
52
53
54
55
56
57
58
59
60
61
62
import torch
from torch import optim
from torch import nn

from matplotlib import pyplot as plt

import matplotlib.animation as animation

# device = torch.device("cuda" if torch.cuda.is_available() else "cpu")

# 准备数据
inputs = torch.unsqueeze(torch.linspace(-10,10, 600),dim=1)

targets = 2.55*inputs + 1.89 + torch.normal(0, 1, inputs.shape)

real = 2.55*inputs + 1.89

# 搭建网络
class NetWork(nn.Module):
def __init__(self):
super(NetWork,self).__init__()
self.linear = torch.nn.Linear(1,1)

def forward(self,x):
x = self.linear(x)
return x


# 定义网络
network = NetWork()


# 定义损失函数
loss_fn = nn.MSELoss()

# 定义优化器
optimizer = optim.SGD(network.parameters(),lr=0.001)

fig, ax = plt.subplots()
ims = []
for i in range(101):
out = network(inputs)
loss = loss_fn(out,targets)
optimizer.zero_grad()
loss.backward()
optimizer.step()
# 可视化训练结果
if i%2 == 0:
# 绘制真实的曲线
frame0, = ax.plot(inputs.numpy(),real.numpy(),c='blue',lw='3')
# 绘制有误差的散点图
frame1, = ax.plot(inputs.numpy(),targets.numpy(),c='orange')
# 绘制神经网络实时预测的曲线
frame2, = ax.plot(inputs.numpy(),out.data.numpy(),c='red',lw='3')
title = ax.text(1, -6, 'Time=%d Loss=%.4f' % (i, loss.data.numpy()), fontdict={'size': 15, 'color': 'red'})
# 这里是关键,更新图片中文字
ims.append([frame0,frame1,frame2,title])

ani = animation.ArtistAnimation(fig, ims, interval=50, blit=False,
repeat_delay=1000)
ani.save('dynamic_images.gif')

4.REFERENCE

https://stackoverflow.com/questions/49158604/matplotlib-animation-update-title-using-artistanimation

文章作者: 小王同学
文章链接: https://morvan.top/2021/09/01/神经网络拟合线性模型可视化/
版权声明: 本博客所有文章除特别声明外,均采用 CC BY-NC-SA 4.0 许可协议。转载请注明来自 小王同学的精神驿站